Analysing Pedestrians in Melbourne, Austrialia
Pedestrains in a city on average represent its population increase, the development, tourists etc. In this project I am considering mainly these facts
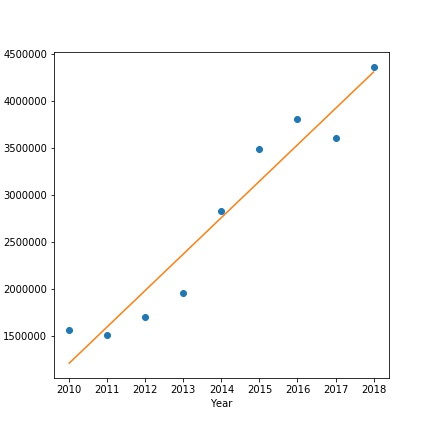
The population increases in Melbourne as an increase of pedestrians can be seen. I have fitted a linear regression to this number and it shows that on 2019 the number of pedastrians will be 4e8
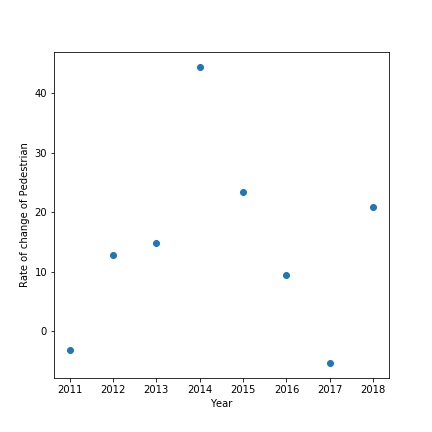
Based on these numbers I can calculate the rate of change of population from 2009, i.e. the population in the next year increses by N% of the previous year
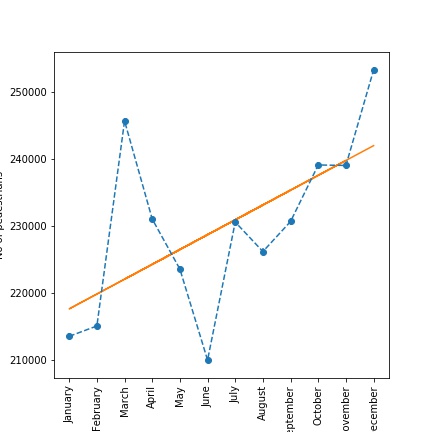
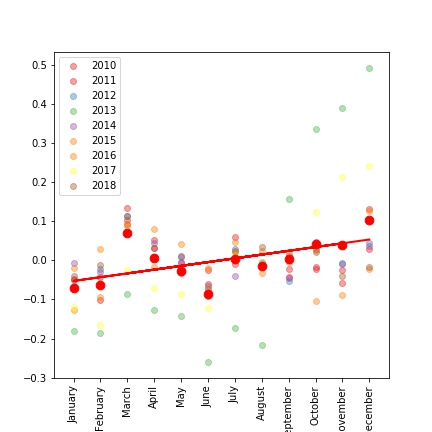
Pedatrians are significantly low in the month of June. I use Poissonian distribution for the count to find error, which is invisibly small. It could be seasonal as it repeats every year. This shows that many people take vaccation during the summer time. Another significant number of pedestrian is on March. Till this point I have no explaination for that. It could be an event going on in the city. Other points are mostly aligned with the fitted line. It should be noted that December has the highest number of people on the street because of Chritsmas and it decreases suddenly in January. I attempted to fit a linear model. However, the data suggests that it needs a high variant model
To compare different years I estimated the fraction of pedestrians by yearly basis. 2013 is the only year different from other. However, the general trend is the same with minimum people are in the first half and much higher numbers in the second half of that year.
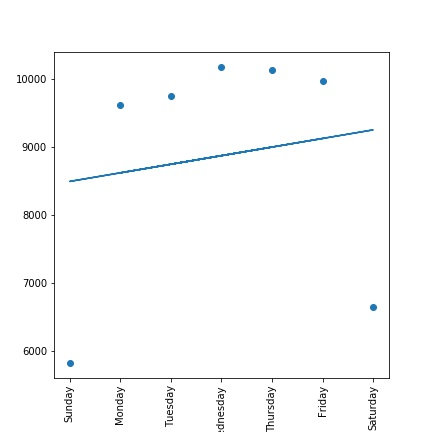
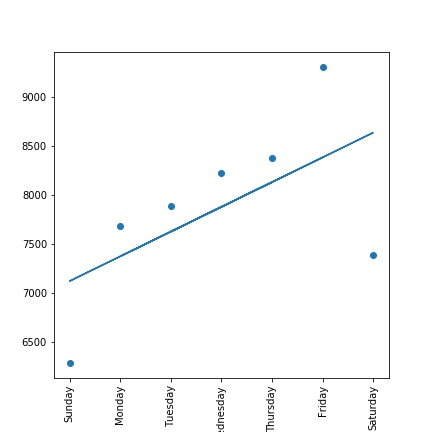
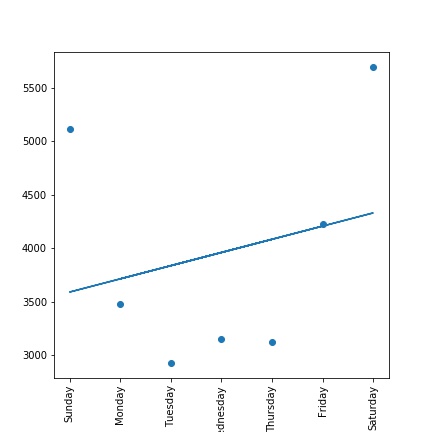
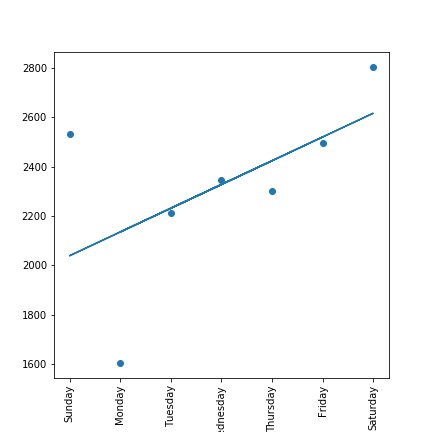
Now I am looking at the pedestrians count in the weekly basis. The following plot shows a few interesting things: 1. The pedastrians are maximum on Friday. Friday is the happiest time of their lives in the whole week! They may go outside to eat, drink and other happy occations which definitly increases the pedestrian count on Friday. After that there is a sudden drop on Saturday and very low on Sunday. I am not quite clear why the count is increasing from Monday to Friday. It is possible that tourists could be the reason. I attempted to fit a linear model but it is highly biased
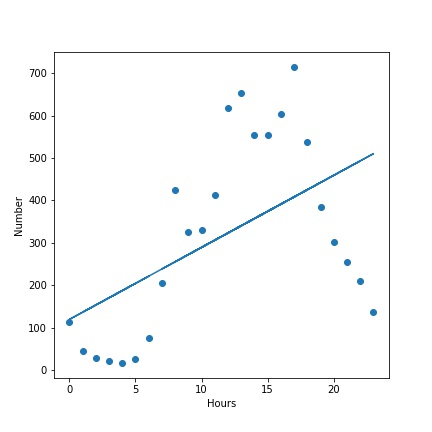
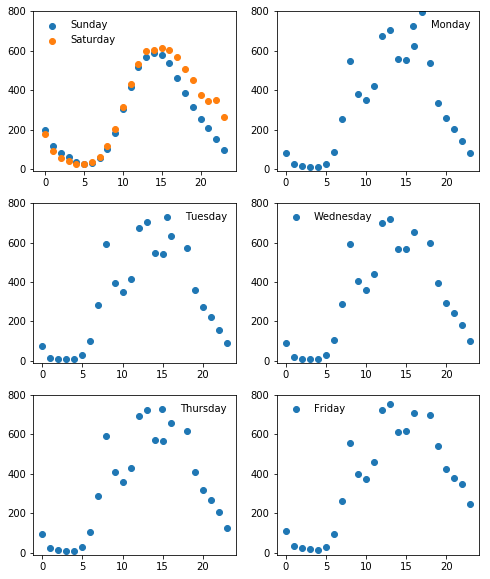
Of course the next thing is to find out what is the hourly pedestrain population. This will tell what is the busiest time in the city. For that I am using hourly population. As below figure shows that the city is most likely crowded at 5pm. This is true for all the years. Fun fact: the shape of the curve is interesting as it similar to a normal distribution (You: what is the mean or std Me: Okay, okay it is really really fun!).
It is seen that in the nights of Friday and Saturday the number of pedestrains is very high. This is expected as more and more people go outside during the weekends. On the otherhand all other days have negligible number of people including Sunday night. This can be seen in the following figure
I look at a few different places and then study the population. First I look at two parks which I found from google map. As I expected that the population is higher on Saturday and Sunday. This can see in the following.
Next I checked the number of pedestrains at a market named QVM. As expected Saturday and Sunday have higher number of pedestrians. Interestingly, Monday has the minimum people in the Market.
I use the number of pedestrians in University of Melbourne. As we expected this number is minimum on Saturday and Sunday. The figure is shown in the following