Boston crime data analysis
My goal is to analyse the following questions from crime data in Boston
- Is there any time or temperature dependence on crimes?
- What is the spatial distribution of different crimes in Boston?
- What is the correlation coefficient of the number of different crimes?
Data
I did my analysis on the crime data from Boston open data hub. There are a few different geospatial databases such as the Boston neighborhood and open space used in the analysis. The crime data is from 2015 June to 2019 October. However, I removed 2015 June and 2019 October data as those months don’t have all the crime data.
Analysis
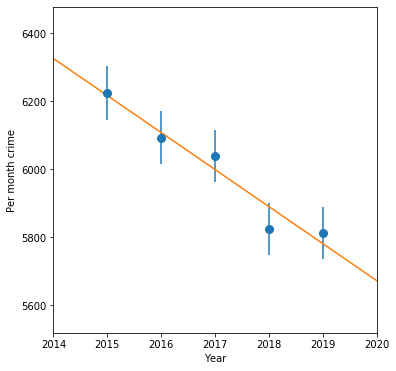
I have done the analysis based on the columns OFFENSE_CODE_GROUP, OFFENSE_DESCRIPTION, YEAR MONTH, HOUR, Lat and Long. I found the per month crime for all the years and found that the number peaked in 2017 and it is decreasing by more than 250 cases per month in 2019. A figure (figure 1) is shown in the appendix. I removed motor vehicle accident response, medical assistance, towed etc unless otherwise notified. Based on this data the number of crime is decreasing as a linear function of year as shown in the following figure. I found the parameter of the linear function with slope -108. This means that number of crimes per month is decreasing at the rate of 108 during these years.
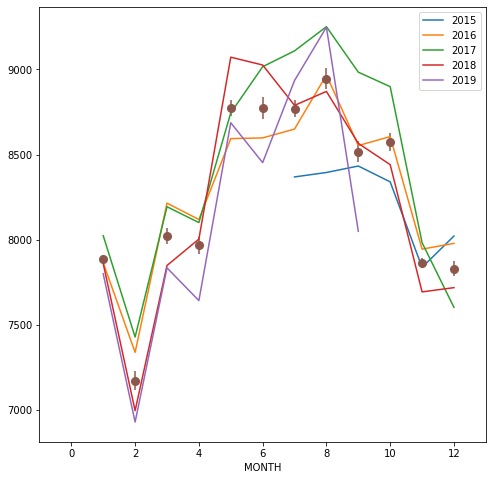
After that I studied the time dependence of crimes as a function of month. I found that the crime peaks between April and October. It peaks more than 500 during these months compared to rests. It was found that the result is similar for individual years also. I assume that this behavior is as expected since during the summer time people go outside and unfortunately get more time to do minor/medium crime.
Temperature dependence of criminal activities
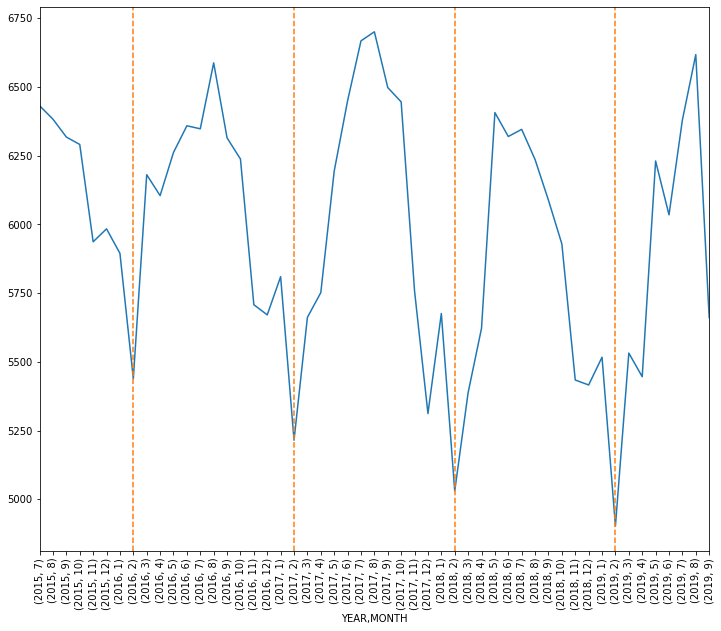
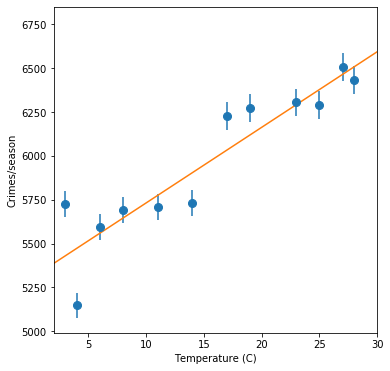
From the figure (figure 2) in appendix I found that the number of crimes is the lowest in February. This is one of the coldest months. Therefore, I used the average temperature of month as a quantitative description of the month. I plotted the number of crimes and temperature of the month in degree celsius. The figures in the appendix show that the number of crimes is a linear function of the temperature. The rate of change of number of crimes is 43 per degree celsius. However, this is a systematic trend as the density of people is larger in the city which unfortunately makes more crimes. After removing this systematics I will show the quantitative description of the temperatude dependence of criminal activities.
I calculate the number of monthly criminal activities and divide this by the total number of crimes in the respective year. E.g. NJ is the number of montly criminal activity in January 2015 and N is total number of criminal activities in 2015 then I calculate the fraction NJ/N. In this way I am normalizing the number of crimes for each number and removing the systematic caused during the temperature dependence on number of crimes. In the following figures I show the results
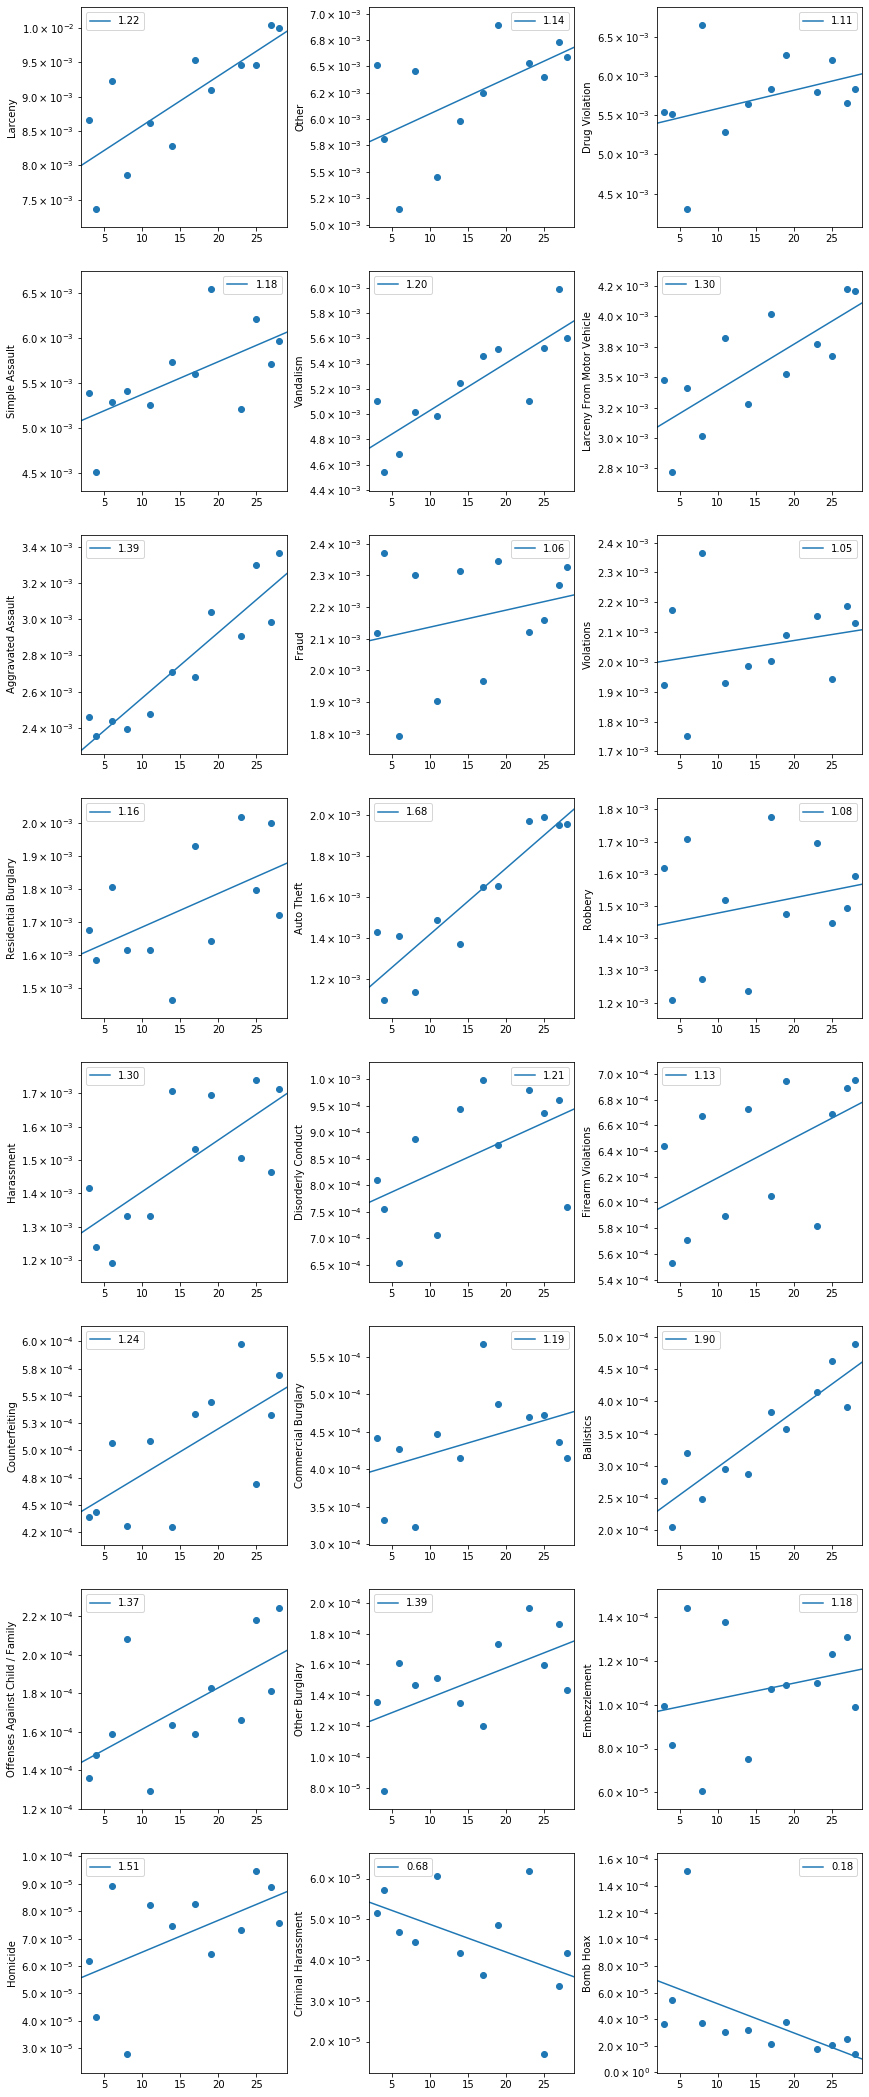
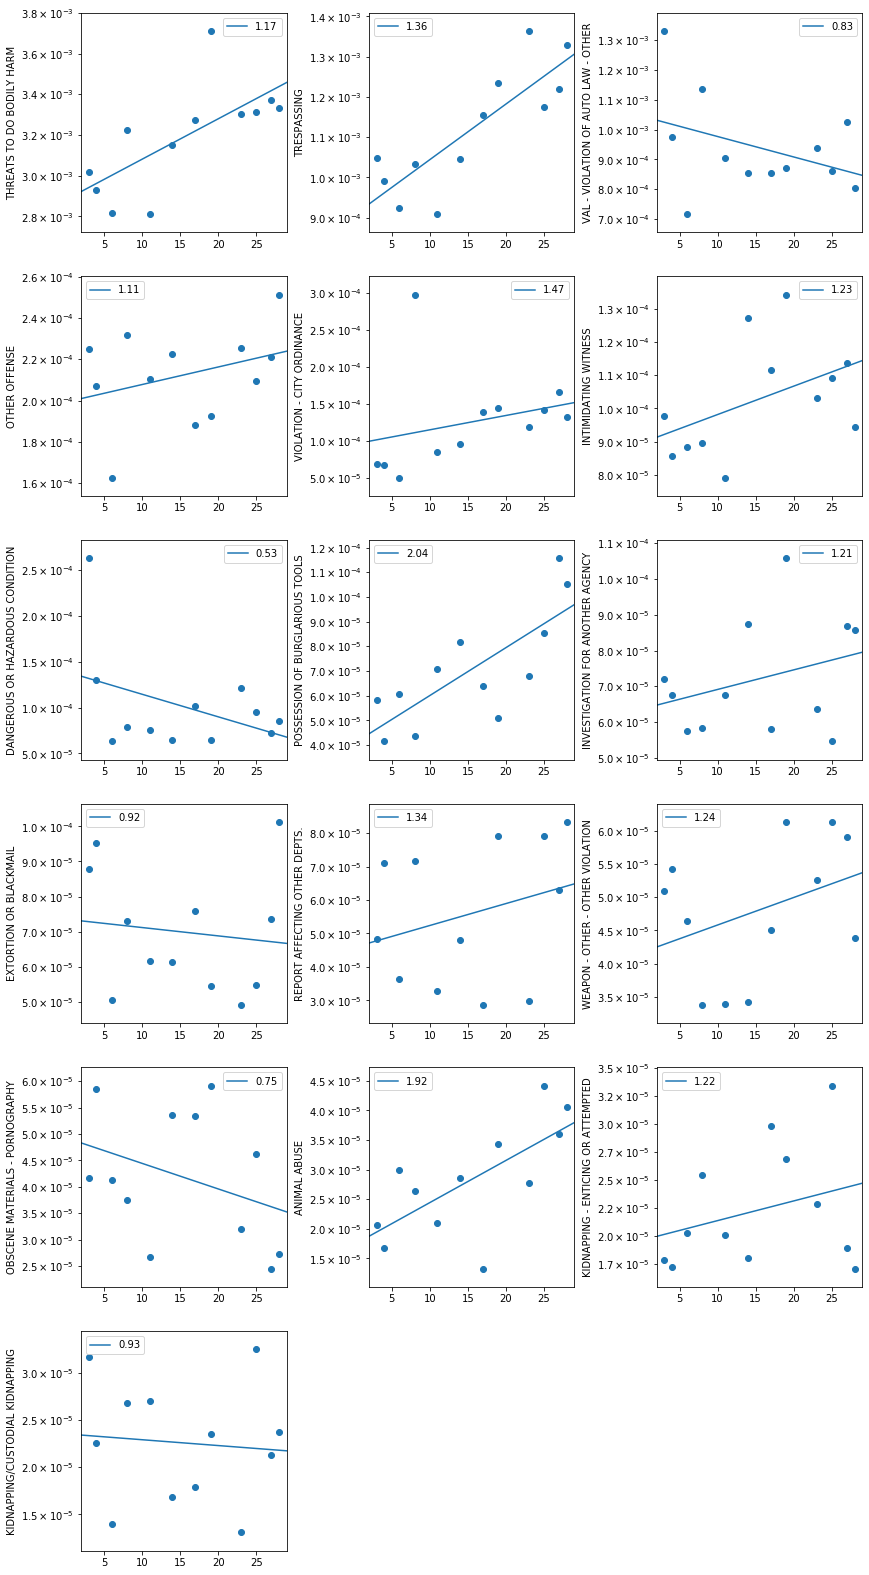
Here there are several quatitative results in these figures.
-
Larceny, simple assault, vandalism, larceny from motor vehicles, aggravated assault, auto theft, harrasment, ballistics, offenses against child or family, other burglary, homicide, threat to bodly harm, trespassing, violaton of city ordinace, possession of burglarious tools, animal abuse have positive correlation with temperature
-
Larceny increases 22% from a temperature of 3 to 28 degree celsius
-
Simple assaults (18%), vandalism (20%), larceny from motor vehicles (30%), aggravated assaults (39%), auto theft (68%), harrasment (30%), ballistics (90%), offense against child or family (37%), other burglary (39%), homicide (51%), threat to bodily harm (17%), trespassing (36%), possession of of burglarious tools (104%), animal abuse (92%) are the quatitative percentage increase from the above temperature
-
Criminal harassment decreasing 32%, Bomb hoax decreases by 80%
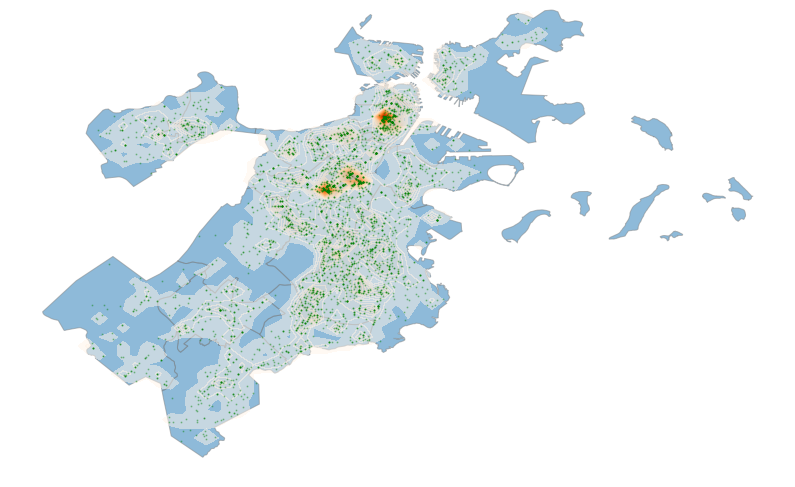
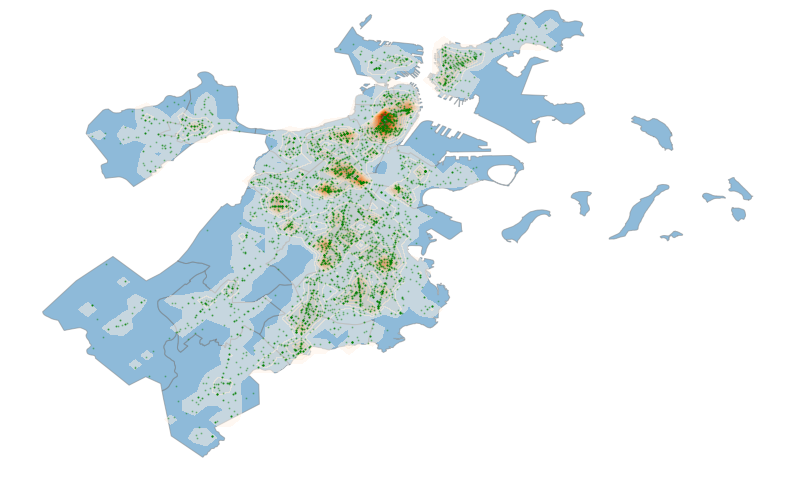
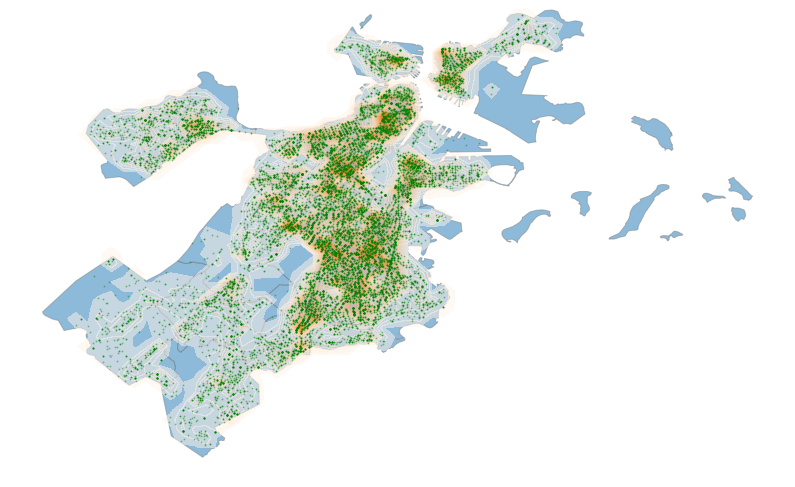
Geospatial analysis
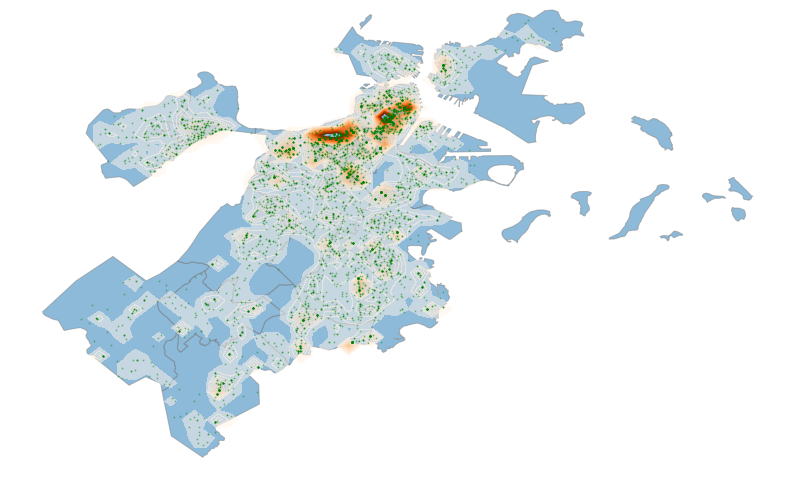
In all of the following geospatial figures I used three different plotting layers. In the bottom one I used the shape of the neighborhood. In the middle I used the contour levels based on the individual points which I plotted in the top.
When I analyze this data I want to know where the most number of homicides are in Boston. So I have plotted the number of homicides not separated by years of crime.
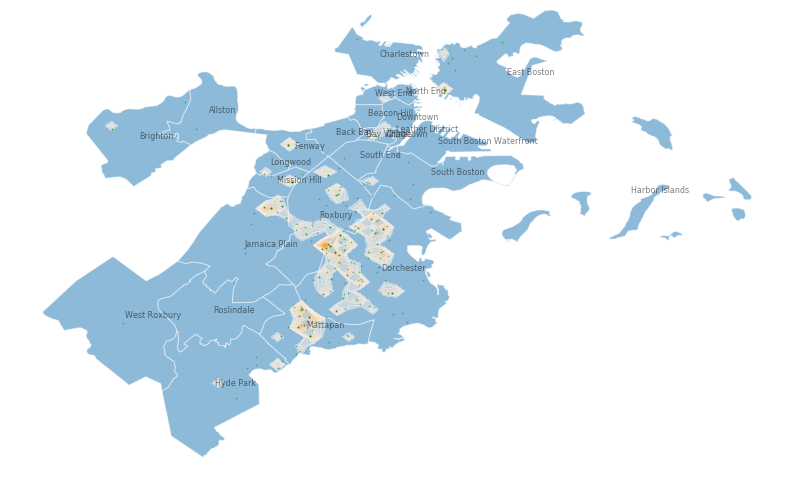
I use spatial distribution of larceny. It shows that it is the largest in the Downtown and Back Bay areas. Larceny distribution is mostly uniform everywhere apart from the center of the city
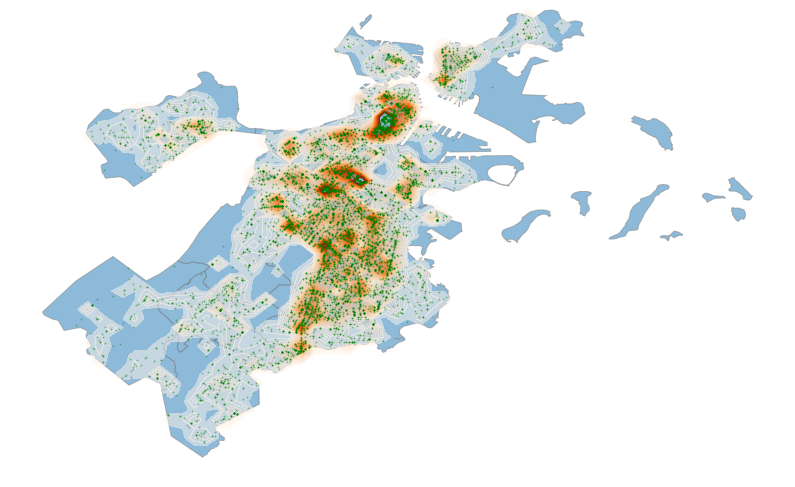
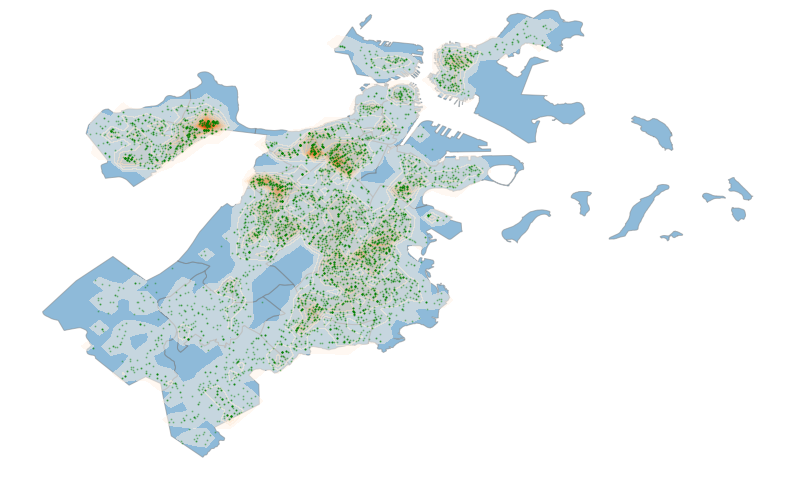
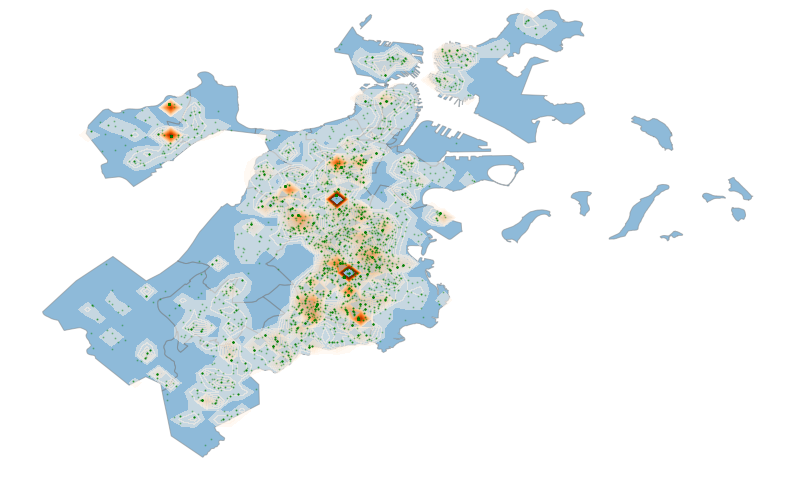
A few different spatial distributions of crimes are shown in the appendix (figure 6). The main points from these figures
- Vandalism, auto theft, harassment don’t have any particular peaks.
- Aggravated assault, robbery, simple assault, commercial burglary have significant peaks
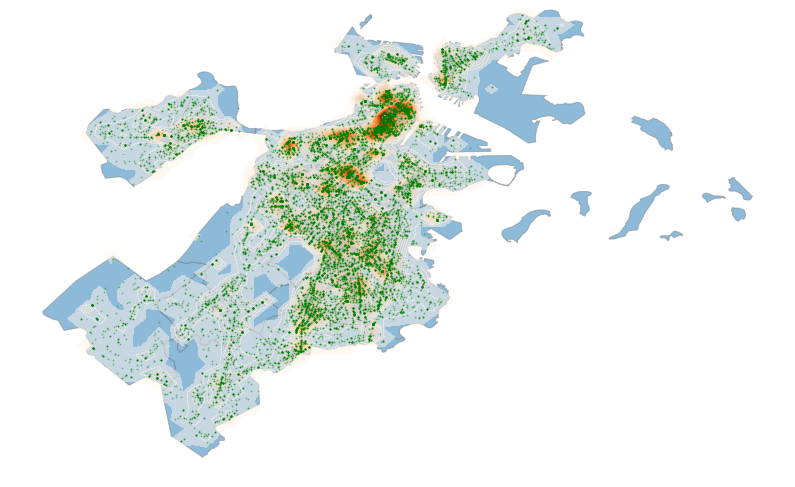
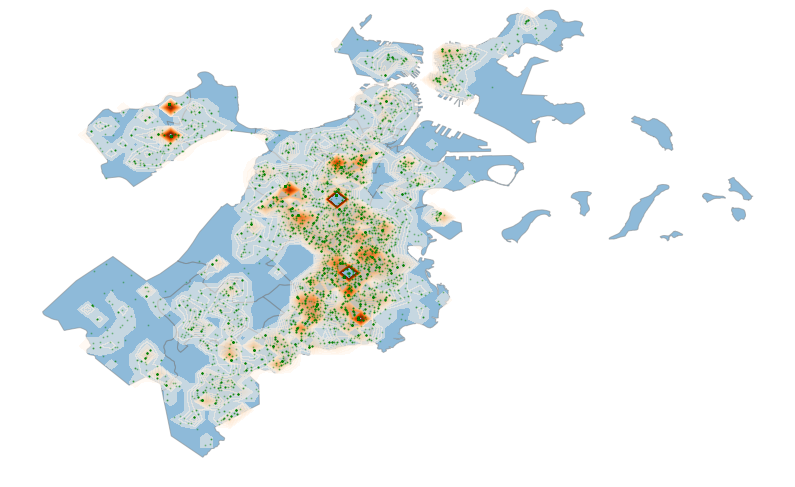
One of the most important crimes is substance use. There are 14 peaks for this crime in the city and those are very spatially congested. The following are the total cases
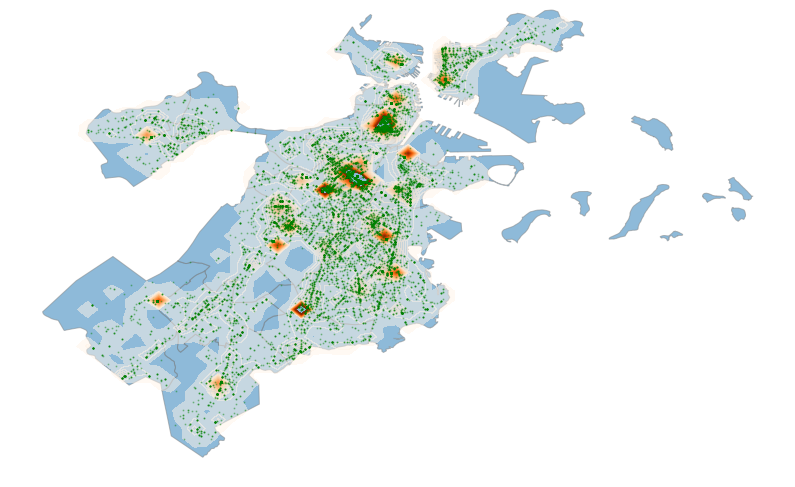
Based on the figures (figure 6) given in the appendix, I found that the number of peaks in the spatial distribution is lowest in class A and increased to class B. There are clear peaks on drug sales and manufacturers.
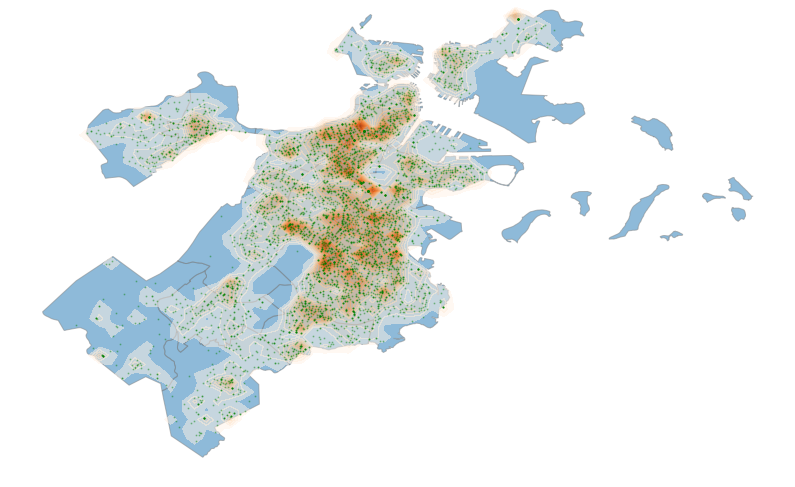
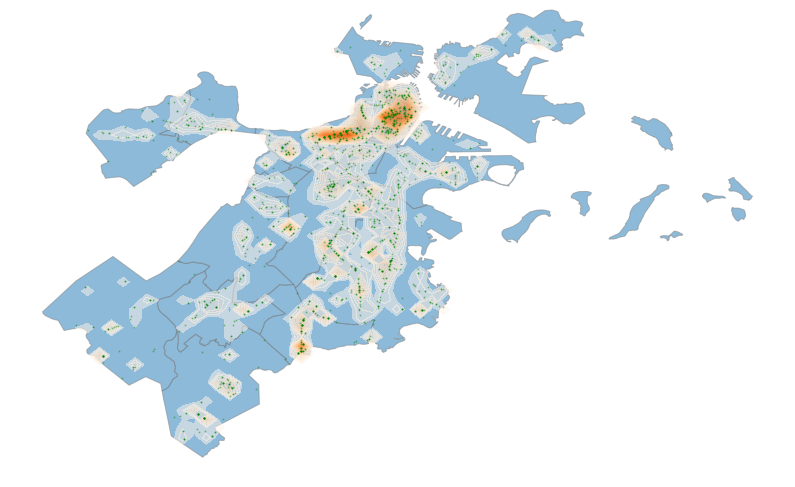
One of the other findings is about the distribution of missing person and distribution of location of the mission person found. From the two distributions it is found that the person missing is found from the same location. It is shown in the appendix (figure 6)
Obviously the spatial distribution of larceny from motor vehicles peaks in the center of the city as there are a larger number of vehicles there
Correlation analysis
I analyze the correlation between the different crimes in the database. I estimate the number of crimes based on the hour it happens. Based on this number I can estimate what are the correlations between different crime groups. I removed crime codes such as Motor Vehicle Accident Response, Medical Assistance, Restraining Order Violations etc and crimes that have few in numbers. Eg. I don’t use aircraft, human trafficking etc. I used 22 different groups for the correlation. This is shown here
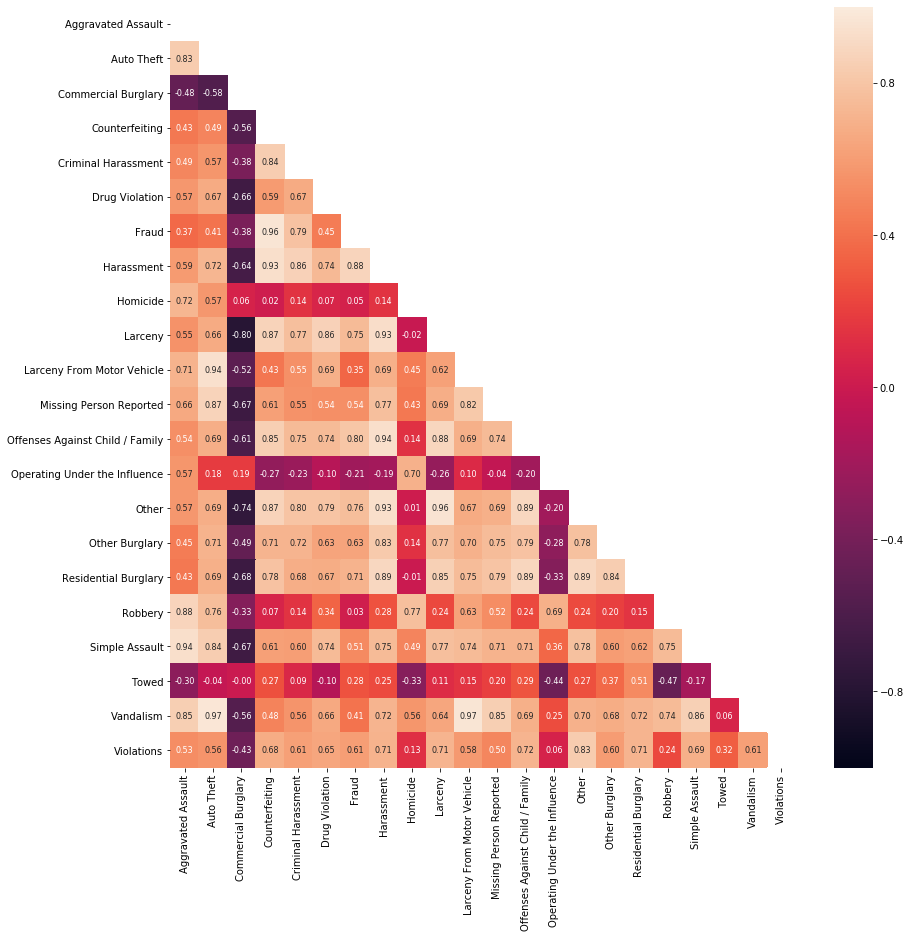 If the police force can find a number in the beginning of the day they can get an expected count of crime throughout the day.
Results
I found the time and temperature dependence of crime in Boston. I made spatial analysis of different crimes and discussed the possible points from the distribution. I estimate the number of crimes per hour and can get expected number throughout the day from the initial numbers
Appendix
Yearly crime dependance
Figure 1
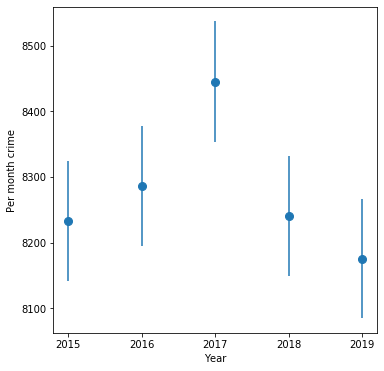 Per monthly crime
Time dependence
Figure 2
Systematics of temperature dependance
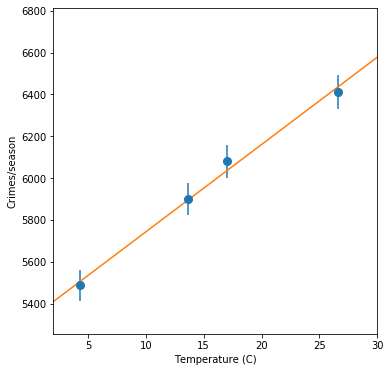
Figure 3
The above results show that even though the number of crimes decreases as a function of years one should take extreme caution during the summer time. This can be shown as a function of seasonal temperature in the appendix (figure 3)
The below figure shows the similar results but it is as a function of hours in the day. The figure describes the ratio of number of crimes in the coldest months to the warmest months as a function of hour. It shows the the fraction is clearly lower in the coldest months. It is noted that the number of crimes peaks around afternoon but suddently drops after evening. This implies that the city is safer in the colder months compared to the warmer months.
Figure 4
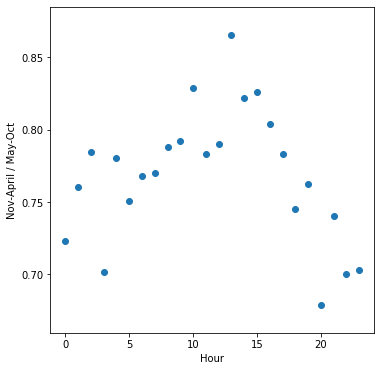
Figure 5
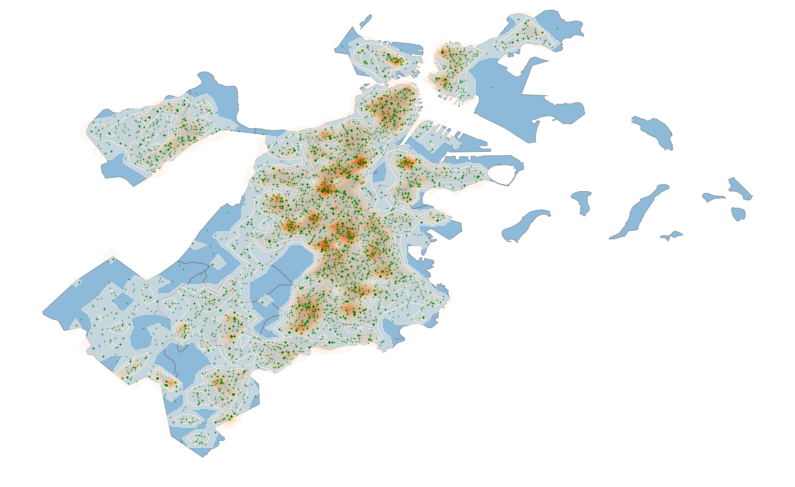
Geospatial analysis
Figure 6