Analysis of job ads
Job advertisement is a great platform for analysing different job categories. It tells us how many jobs are there in the country and how these jobs are distributed. This project quantitatively measures job posts in every state and cities where the job seekers may go. It gives an idea about the places where the companies should focus on the future.
In this project I considered ten different job categories which I took from the title of the job posted. I consider data science, engineers, store employees, medical staff, sales, driving, restaurant, finance, beauty, and other jobs.
I will explain the data analysis in the following section after giving some interesting results. Below figure shows the fraction of jobs in different categories posted in the USA. It shows that among all of the jobs the number of sales employees are the highest and followed by engineers and store employees. There are several issues defining the store and sales employees. These two categories may be included in the Other job as well. Among all the vacancies there is a significant part of data science jobs too.
I calculated the fraction of categorial jobs in the state to the total categorial jobs in the US. E.g. for data science category it calculates the fraction of total number of data science jobs in different states to the total number of data science jobs in the USA. In this case we can look at the distribution of jobs in different states. However, it should be remembered that the number of qualified candidates and population may be directly correlated. Currently, I am ignoring that fact.
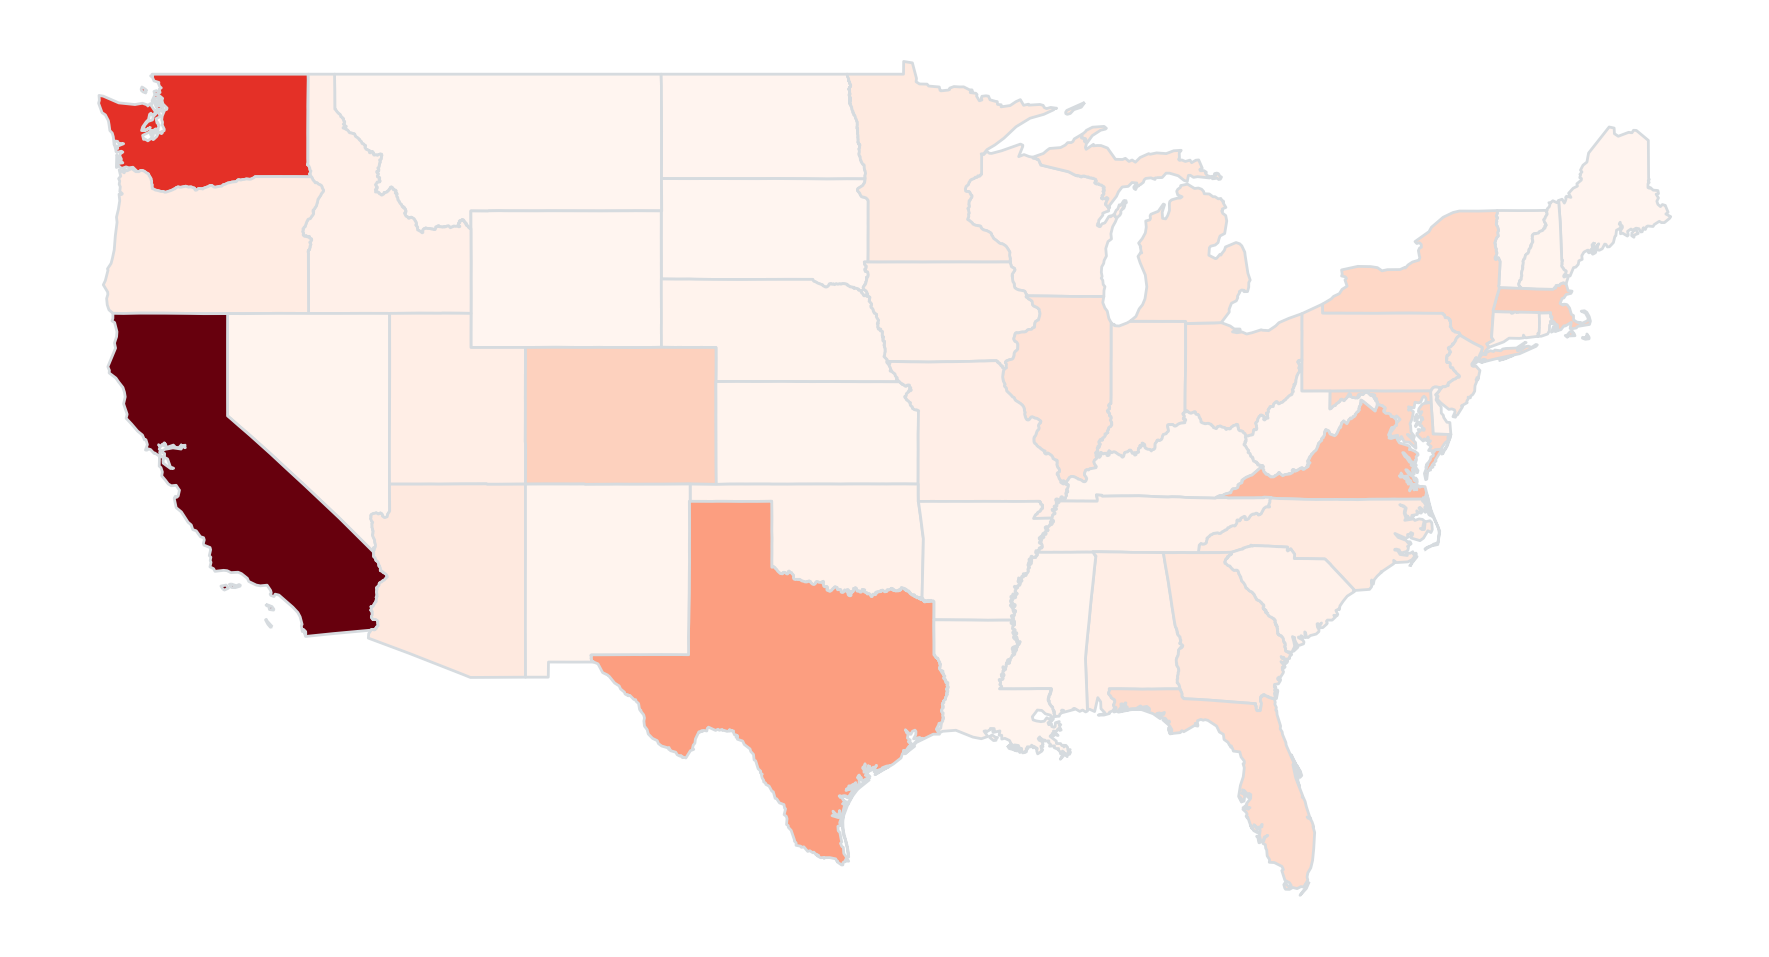
The figure shows the fraction of data science jobs in different states. It shows that California is at the top of the list followed by Washington, Virginia. This is understandable as there are many technological industries in CA, WA etc. It is possible that the availability of Amazon cloud center posts the data science jobs as well. The other significant jobs posted are in NY, Massachusetts and Texas.
Next figure shows the fraction of engineering jobs. It should be noted that software engineers are also included in the engineering catagory. The large fraction of engineer posts was from CA followed by Washington, Texas, Virginia. Engineering category may include sotware engineers which is the most likely cause for the higher numbers in CA and WA. Texas may contain many non-software engineers.
Figures below shows the jobs related to sale and store employees. It is possible that these might not capture all the entries in the job ads. However, the available data shows that the fraction of sale and store employees are dominating in CA, TX and FL.
For the medical profession the fraction of vacancies are higher in CA. It is followed by Texas, Florida. It can be seen that the OH and PA are two of the signicant states in the medical field. It could be because of the Cleveland clinic and medical universities in Pennsilvania.
For the finance job posting CA again tops the list followed by Texas, NY, Pennsylvania and Florida. NY is one of the financial capital of the world and it will surely find its place on the top the category.
Figure shows that Californians, Texasian, Coloradoan, Floridian are the foodies in the US! Those states have more restaurant job vacancies compared to other states. I think people from other states must proteste and they have every reaon to do that.
Beauticians are everywhere but they are mostly in CA, NY, FL, New Jersey and TX.
Spatial distribution of jobs
Here I show the spatial distribution of only data science and engineers
Figure below shows the fraction of engineers and data scientists jobs posted in the US. As we already know that many of the vaccancies are coming from the costal states and a little bit smaller for other states.
Results
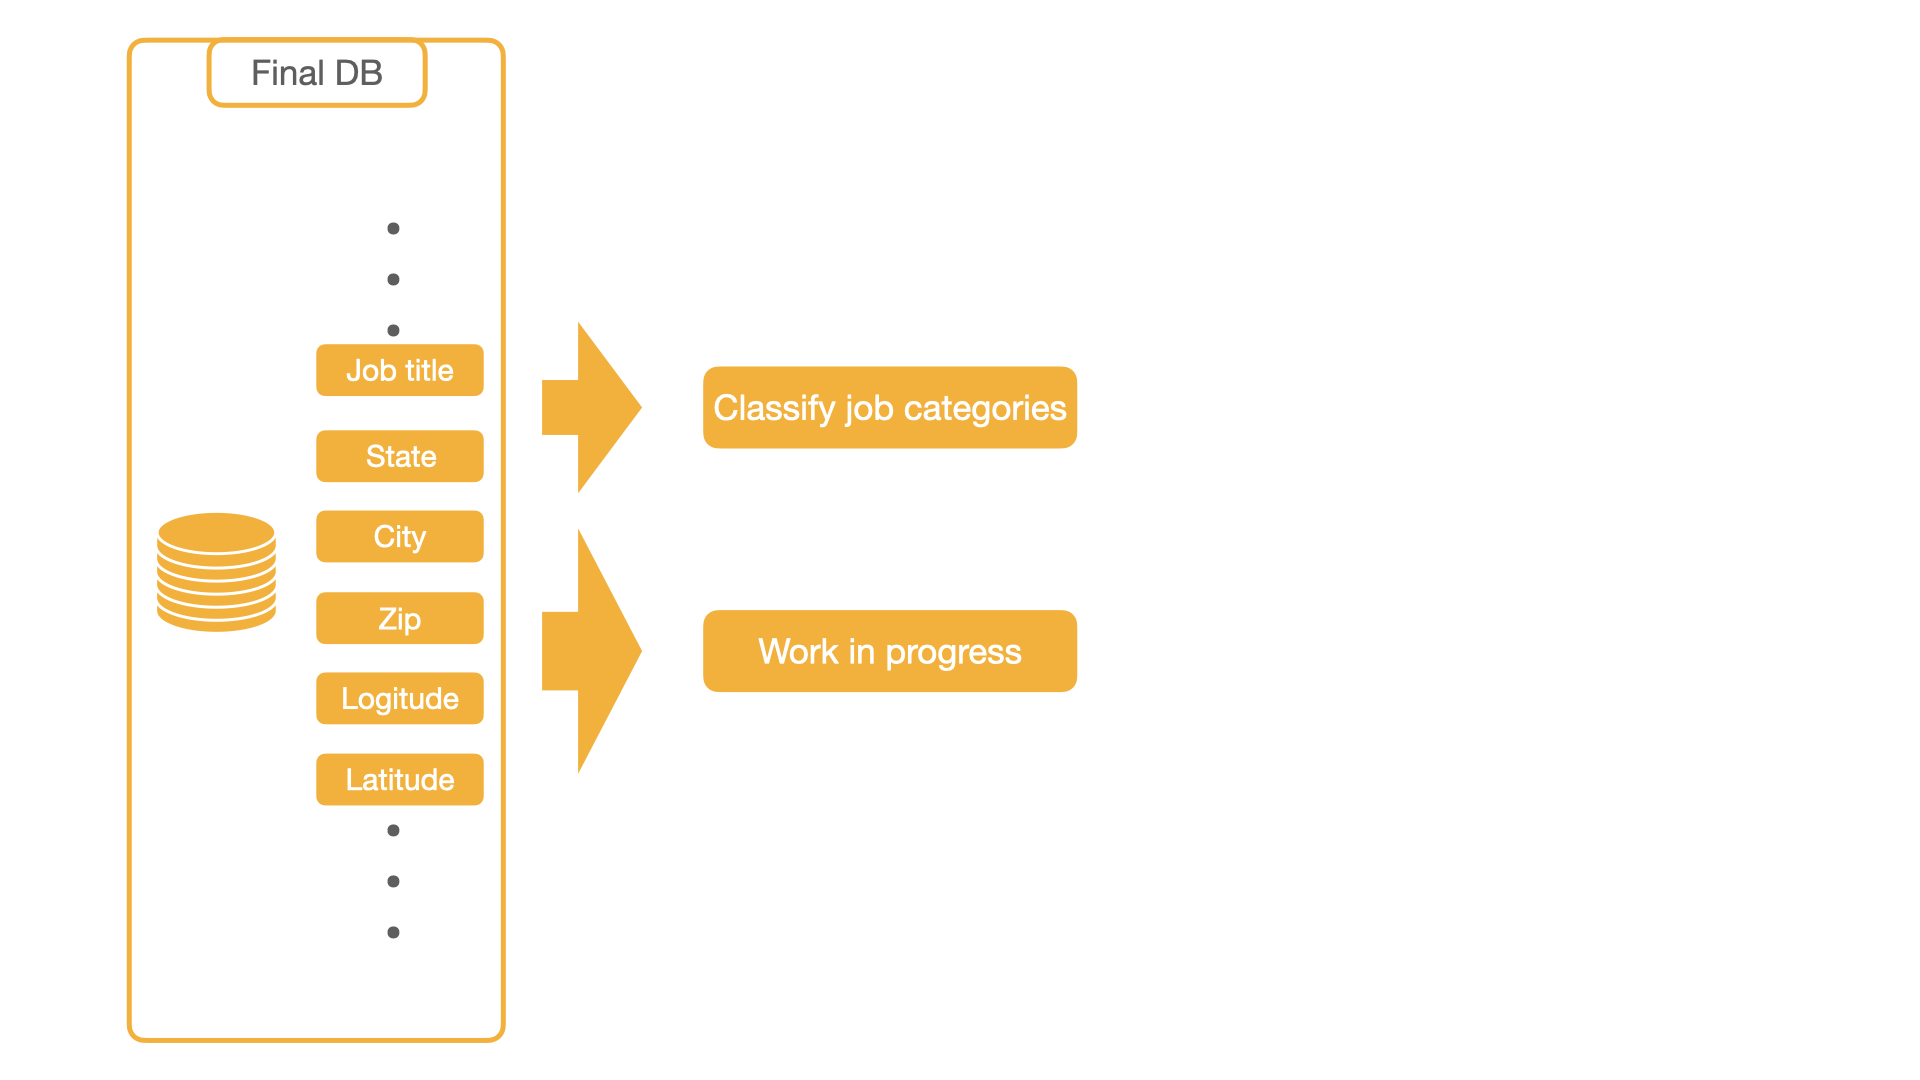
I found that most of the high paying jobs are found in a few states. For many jobs California is on the top of the list. I also found that NY, TX, WA, VA, MA, PA, OH are on the top rank. I am currently working on the percentage of jobs in major cities to find out the distribution of job categories. These analyses are still ongoing and one of the results is shown in section Work in progress.
I am extending the work to find out how the jobs are distributed in different industries based on a case study of data science and data engineering. This will really be useful for data enthusiastics to find out the opportunities waiting in each industry.
Analysis
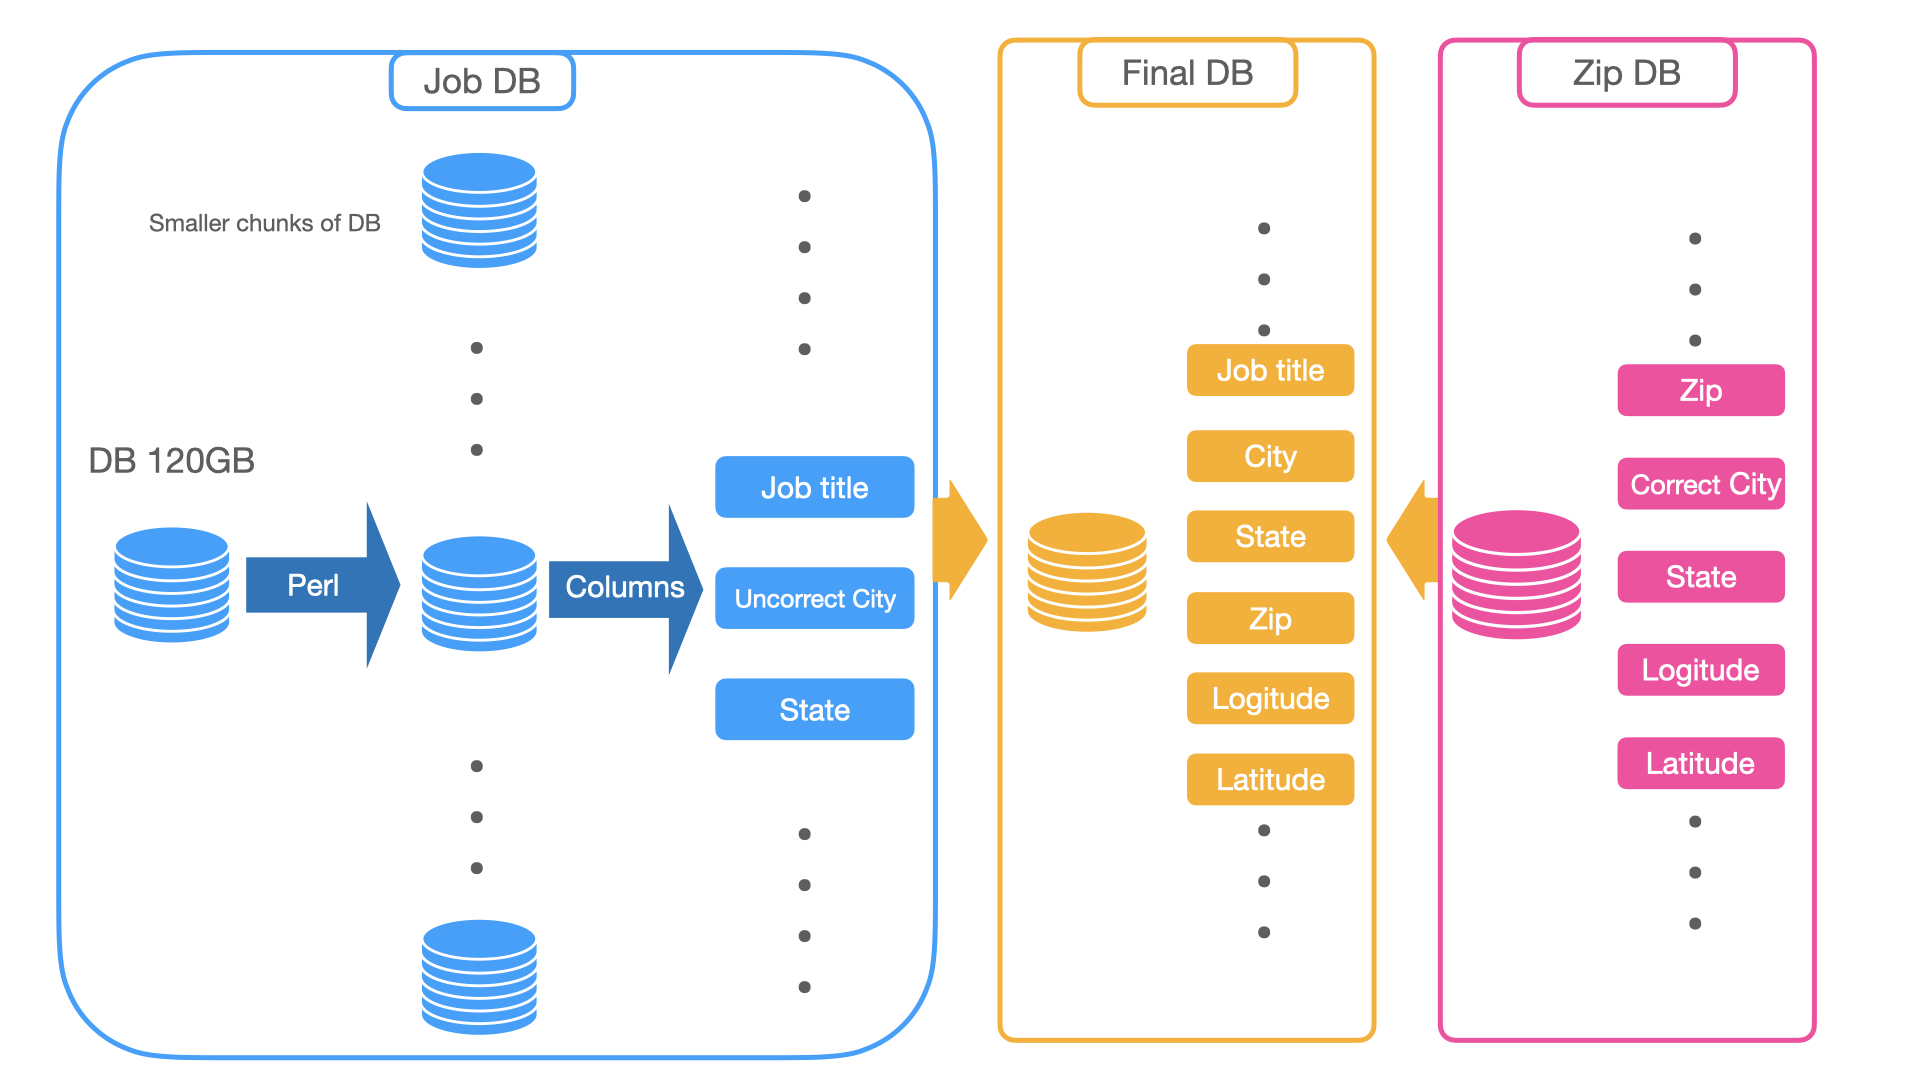
I used job lists from Thinknum with size 115 GB. Since I don’t have much computing power I need to do a divide and conquer strategy to size the files. I splitted the files in to chunks of files with manageble size to process it in the laptop using perl commands. I filtered the data only in the USA. Also I removed unwanted columns. There are many rows containing states in the columns of city and vice versa and I corrected for that. Since I am planning to analyse the data in different cities I need to find the coordinates of the cities where the job was posted. I found that cities in the job data have many spelling mistakes in their name. I use the data from https://public.opendatasoft.com/explore/dataset/us-zip-code-latitude-and-longitude/export/?location=2,43.25174,-99.94353&basemap=jawg.streets which have correct names of the cities. I used fuzzywuzzy to find out the best score between correct city and city in the job data. These two data sets are merged to form a final data base. Final data includes the geographical coordinates and zip code in that region.
The analysis is summarized in the following figures. Left column shows the original job data and the right column shows the zip data. Find 70% accuracy between incorrect city name and corrected city name. The city and state are merged to form the final database which is in the middle column.
I used several key words in the title for describing jobs. I attemped these key words by using n-gram model. Unfortunately, in every categories it fails to find the correct jobs and classified incorrect jobs. Thesefore, I manually checked each unique job titles in Massachussets to find which are the most common words to describe a category. For data science I used {Data, Machine Learning, Statistic}, for engineers {Engineer, Software, Developer}, restaurant employee {Restaurant, Cook, Dishwasher}, store employees {Store, Team member}, medical employees {Nursing, Nurse, Doctor, Pharmacy, Clinic}, driver {Drive, Freight}, sale employees {Sale, Supervisor, Assistant Manager, Lot Associate}, for beauty employee {Beauty} and for financial employees {Banker, Loan, Teller, Account, Fraud}. Around 50% jobs are classified into the above categories. It should be noted that the classified categories may contain same jobs and many of these job categories may still be in the original job data. The data which don’t belongs to the above categories is classified as the ‘Other’ category.
I used R packages ggplot2 and rayshader to make this figure. It shows data science jobs in hundred populous cities in the US. The bottom color shows the total number of DS jobs in states and the bars shows the total number in cities.
The following figue shows the fraction of data science jobs and the population. The bottom color shows that the fraction of DS in states and bar shows in cities.

- States
- Total data science jobs are larger in CA, WA, NY, MA, VA, TX, CO
- Fraction of data science jobs per person is highest in WA, MA, VA, CO, NY, CA, OR, ID
- City
-
Total data science jobs are the highest in Seattle, Metropolitan NY, Metropolitan LA, Chicago, Austin, Boston, Atlanta
-
Fraction of data science jobs per person is highest in Seattle, Metropolitan NY, Metropolitan LA, Atlanta, Boston, Austin. However, when taking the jobs per population Chicago goes to one of the lowest fraction cities
-